USPHS Demographic Report for 2011
Introduction:
The purpose of the report is to show the racial and ethnic diversity of the US Public Health Service Commissioned Corps. This report contains demographic data self-reported by United States Public Health Services (USPHS) Officers in 2006 and 2011. Data were collected from the Commissioned Corps Pay and Personnel System (CCPPS), Active Duty Officers. This report was prepared by and for the USPHS Minority Officers Liaison Council (MOLC) in coordination with the Office of Surgeon General (OSG). To see the updated report click here.
Methods:
The CCPPS collected race/ethnicity data from officers inconsistent with the US Office of Management and Budget Guidelines for reporting race/ethnicity. The Minority Officer Liaison Council (MOLC) categorized the collected data as follows: American Indian or Alaskan Native and Asian or Pacific Islander; Non-Hispanic Black; Hispanic (including Mexican, Puerto Rican, Cuban Sa Origin as Hispanic); Non-Hispanic White; and Unknown (which includes none and unknown origin). The MOLC aggregated these data to be used for the first USPHS Officer demographic report in 2006 (MOLC 2006 Demographic Report) and again in July 2011. MOLC examined the 2006 and 2011 comparative data by race/ethnicity, race/ethnicity by Temporary Grade, and race/ethnicity by USPHS Professional Category. Then the MOLC explored, using only 2011 CCPPS data, the proportion of USPHS Officers that have provided their race/ethnicity by Professional Category and by Temporary Grade.
Findings:
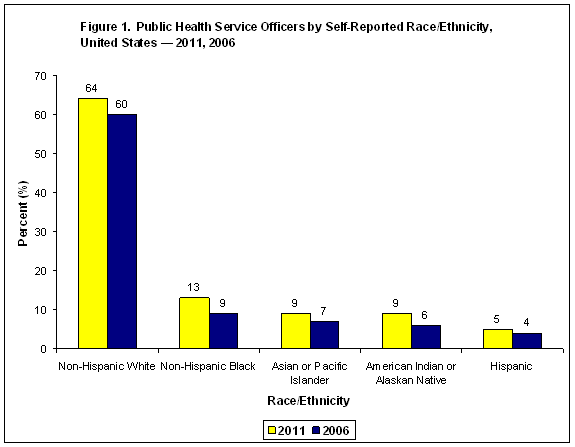
In 2011, 72% (4,739) out of 6,579 Active Duty USPHS Officers self-reported their race/ethnicity as compared with 87% (5,211) of 5,995 Active Duty USPHS Officers in 2006 (data not shown). Among USPHS Officers who reported their race/ethnicity in 2011, 64% self-identified as Non-Hispanic White, 13% as Non-Hispanic Black, 9% as Asian Pacific Islander, and 9% as American Indian/Alaskan Native, and 5% as Hispanic (see Figure 1). Similarly, in 2006, 60% of USPHS Officers who self-identified as Non-Hispanic White, 9% as African American, 7% as Asian or Pacific Islander, 6% as American Indian/Alaskan Native, and 4% as Hispanic (see Figure 1). Approximately 27% of USPHS Officers did not provide information on their race/ethnicity in 2011 compared with 13% in 2006 (data not shown).

Source: Commissioned Corps Pay and Personnel System, Active Duty Officers; 1,840 out of 6,579 Officers in 2011 and 784 out 5,995 Officers in 2006 were removed from this analysis since race/ethnicity was not reported.
Note: Source does not conform to the OMB Guidelines for race/ethnicity. Race/ethnicity were categorized as follows: American Indian or Alaskan Native and Asian or Pacific Islander; Non-Hispanic Black; Hispanic (including Mexican, Puerto Rican, Cuban Sa Origin as Hispanic); Non-Hispanic White; and Unknown (which includes none and unknown origin).
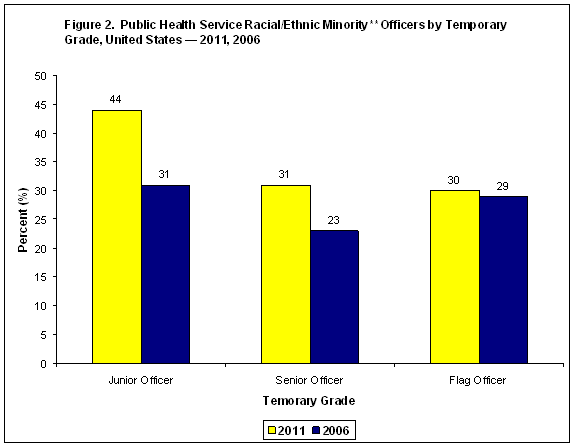
In 2011, 44% of Junior Officers, 31% of Senior Officers, and 30% of Flag Officers self-identified into one of the racial/ethnic minority groups (See Figure 2). Similarly, in 2006, 31% of Junior Officers, 23% of Senior Officers, and 29% of Flag Officers self-identified into one of the racial/ethnic minority groups.

Source: Commissioned Corps Pay and Personnel System, Active Duty Officers; 1,840 out of 6,579 Officers in 2011 and 784 out 5,995 Officers in 2006 were removed from this analysis since race/ethnicity was not reported.
Note: Source does not conform to the OMB Guidelines for race/ethnicity. Race/ethnicity were categorized as follows: American Indian or Alaskan Native and Asian or Pacific Islander; Non-Hispanic Black; Hispanic (including Mexican, Puerto Rican, Cuban Sa Origin as Hispanic); Non-Hispanic White; and Unknown (which includes none and unknown origin). Officers at the O-1 through O-4 Temporary Grade were grouped as Junior Officers, Officers at the O-5 and O-6 Temporary Grade were grouped as Senior Officers, and Officers at the O-7 and above Temporary Grade were grouped as Flag Officers.
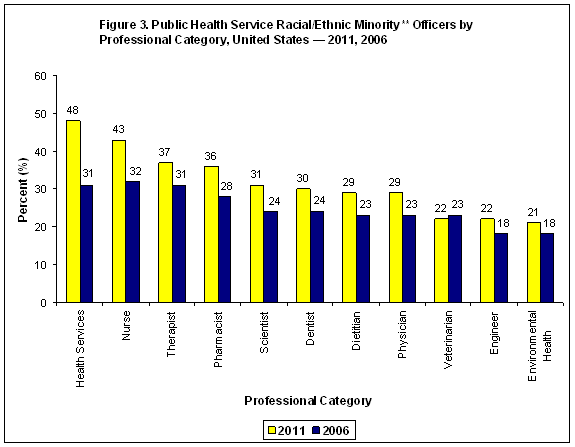
The MOLC aggregated self-reported race/ethnicity data for USPHS Officers by Professional Category as shown in Figure 3. In 2011, the Health Services Officers Professional Category had the highest percentage of racial/ethnic minority officers (48%), whereas officers in Environmental Health Officer Professional Category had the lowest percentage of racial/ethnic minority officers (21%). In 2006, the Nursing Professional Category had the highest percentage of racial/ethnic minority officers (32%), whereas the Environmental Health Officer Professional Category had least racial/ethnic minority officers (18%).

Source: Commissioned Corps Pay and Personnel System, Active Duty Officers; 1,840 out of 6,579 Officers in 2011 and 784 out 5,995 Officers in 2006 were removed from this analysis since race/ethnicity was not reported.
Note: Source does not conform to the OMB Guidelines for race/ethnicity. Race/ethnicity were categorized as follows: American Indian or Alaskan Native and Asian or Pacific Islander; Non-Hispanic Black Hispanic (including Mexican, Puerto Rican, Cuban Sa Origin as Hispanic); Non-Hispanic White; and Unknown (which includes none and unknown origin).
In 2011, Twenty-eight percent of USPHS Officers did not identify their race/ethnicity. The proportion of officers who did not report their race/ethnicity were among Veterinarians (64.8%), Dentists (63.9%), Engineers (63.6%), and Environmental Officers (63.3%). The greatest number of Officers whom did not report their race/ethnicity were among the Health Services (522), Nurse (479), and Pharmacy (303) Categories.
Table 1. Public Health Service Officers, by Race/Ethnicity and Professional Category, United States, — 2011
| Category |
Racial/Ethnic Minority**
% (n) |
Non-Hispanic White
% (n) |
Unknown
% (n) |
Total
% (n) |
| Dentist |
27.3 (90) |
8.8 (29) |
63.9 (211) |
100 (330) |
| Dietitian |
23 (23) |
20 (20) |
57 (57) |
100 (100) |
| Environmental Health |
16.4 (60) |
20.3 (74) |
63.3 (231) |
100 (365) |
| Engineer |
18 (76) |
18.4 (78) |
63.6 (269) |
100 (423) |
| Health Services |
28.1 (354) |
41.5 (522) |
30.4 (383) |
100 (1259) |
| Physician |
24.2 (218) |
18 (162) |
57.8 (521) |
100 (901) |
| Nurse |
29.9 (460) |
31.1 (479) |
39 (600) |
100 (1539) |
| Pharmacist |
26.1 (290) |
27.2 (303) |
46.7 (519) |
100 (1112) |
| Scientist |
24.6 (78) |
21.1 (67) |
54.3 (172) |
100 (317) |
| Therapist |
27.6 (40) |
25.5 (37) |
46.9 (68) |
100 (145) |
| Veterinarian |
18.2 (16) |
17 (15) |
64.8 (57) |
100 (88) |
| Total |
25.9 (1705) |
27.1 (1786) |
46.9 (3088) |
100 (6579) |
**Source does not conform to the OMB Guidelines for race/ethnicity and were categorized as follows: American Indian or Alaskan Native and Asian or Pacific Islander; Non-Hispanic Black Hispanic (including Mexican, Puerto Rican, Cuban Sa Origin as Hispanic); Non-Hispanic White; and Unknown (which includes none and unknown origin).
USPHS Officers by race/ethnicity and Junior, Senior, and Flag Officer status, based on Temporary Grade are displayed in Table 2. While 89% of Senior and 95% of Flag Officer self-reported their race/ethnicity in 2011, almost half of Junior Officers did not report their race/ethnicity (data not shown).
Table 2. Public Health Service Officers, by Race/Ethnicity and Temporary Grade Status, United States — 2011
| T-Grade Status |
Racial/Ethnic Minority**
% (n) |
Non-Hispanic White
% (n) |
Unknown
% (n) |
Total
% (n) |
| Junior Officera |
24 (743) |
31 (940) |
46 (1403) |
100 (3086) |
| Senior Officerb |
28 (951) |
61 (2122) |
11 (381) |
100 (3454) |
| Flag Officerc |
28 (11) |
67 (26) |
5 (2) |
100 (39) |
| Total |
26 (1705) |
47 (3088) |
27 (1786) |
100 (6579) |
**Source does not conform to the OMB Guidelines for race/ethnicity . Race/ethnicity were categorized as follows: American Indian or Alaskan Native and Asian or Pacific Islander; Non-Hispanic Black Hispanic (including Mexican, Puerto Rican, Cuban Sa Origin as Hispanic); Non-Hispanic White; and Unknown (which includes none and unknown origin).
aOfficers at the O-1 through O-4 Temporary Grade
bOfficers at the O-5 and O-6 Temporary Grade
cOfficers at the O-7 and above Temporary Grade
Conclusions:
After reviewing these data, the MOLC would like to highlight several key findings. First, when compared to 2006, during 2011 the percentage of racial/ethnic minority Officers increased in nearly every category and Temporary Grade. However, the percentage of USPHS Officers that did not report their race/ethnicity more than doubled from 2006 to 2011. While identifying ways to improve Officer reporting of their race/ethnicity, targeting Junior, Health Service, Nurse and Pharmacist Officers might have the greatest impact. Additional efforts might be needed to obtain a more accurate estimate of USPHS demographics.
Acknowledgements:
MOLC would like to thank the OSG office for providing the data to make this report possible. This report was prepared as a product of the MOLC Demographic Report Subcommittee.
Below are the individual contributors to this report:
- CDR Dwayne Jarman, 2011 MOLC Chair (AIANCOAC), Chair of the Subcommittee
- LCDR Karen Ho, 2011 MOLC JOAG Representative, Co-Chair of the Subcommittee
- CDR Luis Rodriguez, Ad hoc Member
- LCDR Ashleigh May, Ad hoc Member
- LT Erica Wilson, Ad hoc Member
- LT Quynh Nhu Nguyen, Ad hoc Member
- LCDR Yang Wang, 2011 MOLC Voting Member (APAOC)