USPHS Demographic Report for 2014
Commissioned Corps of the U.S. Public Health Service
Demographic Report
Introduction:
The purpose of the report is to show the racial and ethnic diversity of the US Public Health Service Commissioned Corps. This report contains demographic data self-reported by United States Public Health Services (USPHS) officers in 2014, 2011 and 2006. Data was collected from the Commissioned Corps Pay and Personnel System (CCPPS), Active Duty Officers. This report was prepared by and for the USPHS Minority Officers Liaison Council (MOLC) in coordination with the Office of Surgeon General (OSG). Click here for a pdf version of this report.
Methods:
The CCPPS collected race/ethnicity data from officers is inconsistent with the U.S. Office of Management and Budget Guidelines for reporting race/ethnicity. The Minority Officer Liaison Council (MOLC) categorized the collected data as follows: American Indian or Alaskan Native, Asian or Pacific Islander, Non-Hispanic Black, Hispanic (including Mexican, Puerto Rican, and Cuban origins), Non-Hispanic White, Unknown, and Blank. The MOLC aggregated these data to be used for the first USPHS Officer demographic report in 2006 and again in July 2011. MOLC examined the 2006, 2011 and 2014 comparative data by race/ethnicity, race/ethnicity by temporary grade, and race/ethnicity by USPHS professional category.
Findings:
Based on the data provided by CCPPS in 2014, approximately 66% (4,405) out of 6,678 active duty USPHS officers self-identified their race/ethnicity. In 2011, 72% (4,739) out of 6,579 active duty USPHS officers self-identified their race/ethnicity as compared with 87% (5,211) of 5,995 active duty USPHS officers in 2006 (data not shown).
Among USPHS officers who self-identified their race/ethnicity in 2014, approximately 60.6% self-identified as Non-Hispanic White, 15% as Non-Hispanic Black, 10.3% as Asian Pacific Islander, 8.4% as American Indian/Alaskan Native, and 5.6% as Hispanic (see Figure 1). It is interesting to note that in the general population in the U. S. in 2014, the percentage of different ethnic groups were 62.2% white, 12.4% Black/African American, 5.4% Asian and Native Hawaiian and Other Pacific Islander, 0.7% American Indian and Alaska Native, and 17.4% Hispanics (1). In 2011, 64% self-identified as Non-Hispanic White, 13% as Non-Hispanic Black, 9% as Asian Pacific Islander, and 9% as American Indian/Alaskan Native and 5% as Hispanic. Meanwhile, in 2006, 60% of USPHS Officers who self-identified as Non-Hispanic White, 9% as African American, 7% as Asian or Pacific Islander, 6% as American Indian/Alaskan Native, and 4% as Hispanic (see Figure 1). In 2014, nearly 34% of USPHS officers either marked unknown or left blank the race/ethnicity question. Approximately 28% of officers did not provide information on their race/ethnicity in 2011 compared with 13% in 2006.
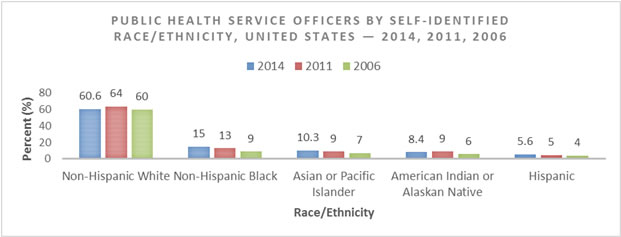
Figure 1 - Source: Commissioned Corps Pay and Personnel System, Active Duty Officers. Note: Source does not conform to the OMB Guidelines for race/ethnicity and the data is not validated (i.e. officers could misrepresent their race/ethnicity). Race/ethnicity is categorized as follows: American Indian or Alaskan Native and Asian or Pacific Islander, Non-Hispanic Black, Hispanic (including Mexican, Puerto Rican, and Cuban), Non-Hispanic White, Unknown, and Blank.
The MOLC aggregated self-identified race/ethnicity data for USPHS officers by professional category as shown in Figure 2. In 2014, the highest proportion of officers in percentages that self-identified in one of the race/ethnicity categories was among Dentist (82%), Engineer (79%), Environmental Health and Veterinarian (75%). In addition, the greatest number of officers that self-identified their race/ethnicity was among the Nurse (971), Pharmacist (806), and Health Services (753). In 2011, categories with the highest proportion in percentages and numbers that self-identified race/ethnicity were as follows: Health Services (70%), Nurse (61%), Pharmacist (53%), and Therapist (53%). The greatest number of officers who self-identified their race/ethnicity was among the Nurse (939), Health Services (876), and Pharmacy (593) Categories.
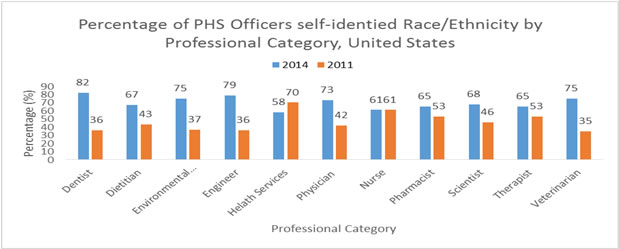
Figure 2 - Source: Commissioned Corps Pay and Personnel System, Active Duty Officers.
Note: Source does not conform to the OMB Guidelines for race/ethnicity and the data is not validated (i.e. officers could misrepresent their race/ethnicity). Race/ethnicity is categorized as follows: American Indian or Alaskan Native and Asian or Pacific Islander, Non-Hispanic Black, Hispanic (including Mexican, Puerto Rican, and Cuban), Non-Hispanic White, Unknown, and Blank.
Among USPHS officers who self-identified their race/ethnicity in 2014, the Health Services Professional Category had the highest percentage of racial/ethnic minority officers (30.1%), whereas the Environmental Health Category had the least racial/ethnic minority officers (16.1%). In 2011, the Health Services Officers Professional Category also had the highest percentage of racial/ethnic minority officers (48%), whereas officers in Environmental Health Officer Professional Category had the lowest percentage of racial/ethnic minority officers (21%). In 2006, the Nursing Professional Category had the highest percentage of racial/ethnic minority officers (32%), whereas the Environmental Health Officer Professional Category had least racial/ethnic minority officers (18%) (See Figure 3).
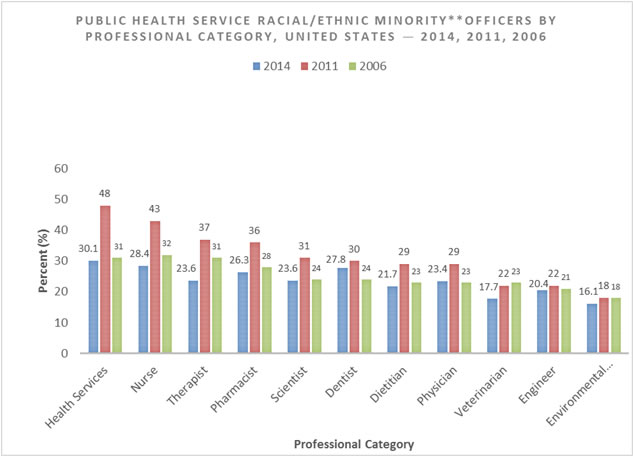
Figure 3 - Source: Commissioned Corps Pay and Personnel System, Active Duty Officers. Note: Source does not conform to the OMB Guidelines for race/ethnicity and the data is not validated (i.e. officers could misrepresent their race/ethnicity). Race/ethnicity is categorized as follows: American Indian or Alaskan Native and Asian or Pacific Islander, Non-Hispanic Black, Hispanic (including Mexican, Puerto Rican, and Cuban), Non-Hispanic White, Unknown, and Blank.
Table 1. Public Health Service Officers, by Race/Ethnicity and Professional Category, United States — 2014
|
Category
|
Racial/Ethnic Minority** % (n)
|
Non-Hispanic White % (n)
|
Unknown % (n)
|
Blank
%(n)
|
Total % (n)
|
|
Dentist
|
27.8 (75)
|
54.6 (147)
|
8.5 (23)
|
8.9 (24)
|
100 (269)
|
|
Dietitian
|
21.7 (22)
|
45.5 (46)
|
20.7 (21)
|
11.8 (12)
|
100 (101)
|
|
Environmental Health
|
16.1 (57)
|
58.9 (208)
|
17.8 (63)
|
7 (25)
|
100 (353)
|
|
Engineer
|
20.4 (80)
|
58.1 (228)
|
16.5 (65)
|
4.8 (19)
|
100 (392)
|
|
Health Services
|
30.1 (392)
|
27.7 (361)
|
30.4 (396)
|
11.7 (153)
|
100 (1302)
|
|
Physician
|
23.4 (195)
|
49.4 (411)
|
14.1 (118)
|
12.8 (107)
|
100 (831)
|
|
Nurse
|
28.4 (455)
|
32.2 (516)
|
26.6 (426)
|
12.6 (202)
|
100 (1599)
|
|
Pharmacist
|
26.3 (325)
|
38.9 (481)
|
22.5 (278)
|
12.1 (150)
|
100 (1234)
|
|
Scientist
|
23.6 (82)
|
43.9 (152)
|
15.6 (54)
|
16.7 (58)
|
100 (346)
|
|
Therapist
|
23.6 (38)
|
40.9 (66)
|
22.3 (36)
|
13 (21)
|
100 (161)
|
|
Veterinarian
|
17.7 (16)
|
57.7 (52)
|
12.2 (11)
|
12.2 (11)
|
100 (90)
|
|
Total
|
26 (1737)
|
40 (2668)
|
22.3 (1491)
|
11.7 (782)
|
100 (6678)
|
** Source does not conform to the OMB Guidelines for race/ethnicity and the data is not validated (i.e. officers could misrepresent their race/ethnicity). Race/ethnicity is categorized as follows: American Indian or Alaskan Native and Asian or Pacific Islander, Non-Hispanic Black, Hispanic (including Mexican, Puerto Rican, and Cuban), Non-Hispanic White, Unknown, and Blank.
As shown in table 2, in 2014, 49% of junior officers, 81% of senior officers, and 94% of flag officers self-identified into one of the racial/ethnic groups.
Table 2. Public Health Service officers, by race/ethnicity and temporary grade status, United States — 2014
|
T-Grade Status
|
Racial/Ethnic Minority** % (n)
|
Non-Hispanic White % (n)
|
Unknown % (n)
|
Blank
%(n)
|
Total % (n)
|
|
Junior Officer
|
23.5 (753)
|
25.4 (814)
|
26.7 (857)
|
24.2 (774)
|
100 (3198)
|
|
Senior Officer
|
28 (972)
|
53.2 (1836)
|
18.3 (633)
|
0.2 (7)
|
100 (3448)
|
|
Flag Officer
|
37.5 (12)
|
56.2 (18)
|
3.1 (1)
|
3.1 (1)
|
100 (32)
|
|
Total
|
26 (1737)
|
40 (2668)
|
22.3 (1491)
|
11.7 (782)
|
100 (6678)
|
**Source does not conform to the OMB Guidelines for race/ethnicity and the data is not validated (i.e. officers could misrepresent their race/ethnicity). Race/ethnicity is categorized as follows: American Indian or Alaskan Native and Asian or Pacific Islander, Non-Hispanic Black, Hispanic (including Mexican, Puerto Rican, and Cuban), Non-Hispanic White, Unknown, and Blank.
Junior Officer at the O-1 through O-4 Temporary Grade Senior Officer at the O-5 and O-6 Temporary Grade Flag Officer at the O-7 and above Temporary Grade
Among those who self-identified as minority officers in 2014, 23% were junior officers, 28% were senior officers and 38% were flag officers. While in 2011, among those who self-identified as minority officers, 24% were junior officers, 28% were senior officers and 28% were flag officers (See Figure 4). The flag officers showed approximately 10-percentage point increase in a 3-year span (there were 11 and 12 flag officers in 2011 and 2014 respectively).
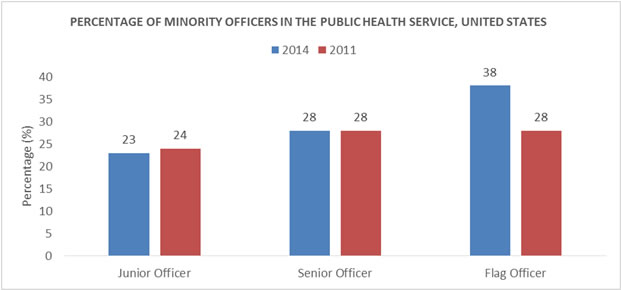
Figure 4 - Source: Commissioned Corps Pay and Personnel System, Active Duty Officers.
Note: Source does not conform to the OMB Guidelines for race/ethnicity and the data is not validated (i.e. officers could misrepresent their race/ethnicity). Race/ethnicity is categorized as follows: American Indian or Alaskan Native and Asian or Pacific Islander, Non-Hispanic Black, Hispanic (including Mexican, Puerto Rican, and Cuban), Non-Hispanic White, Unknown, and Blank.
Conclusions:
After reviewing the 2014 self-reported race/ethnicity data, the MOLC would like to highlight several key findings. Comparing data among 2006, 2011 and 2014, the percentage of USPHS officers who have self-identified their race/ethnicity varies among different ethnic groups. It is noted that there is about one-third of USPHS officers who did not self-identify their race/ethnicity in 2014; therefore, new efforts are needed to encourage officer reporting of race/ethnicity in order to enhance and strengthen USPHS demographics. In addition, among USPHS officers who self-identified their race/ethnicity in 2014, the percentage of minority officers has decreased across every PHS category compared to 2011. Lastly, the findings show that among those who self-identified their race/ethnicity in 2011 and 2014, there was no significant change in the percentage of minority officers among junior officers and senior officers. There was an approximate 10% increase in the number of flag officers who self-identified as minority race/ethnicity between 2011 and 2014.
Acknowledgements:
MOLC would like to thank the OSG office for providing the data to make this report possible. This report was prepared as a product of the MOLC Demographic Report Subcommittee.
LCDR Karina Aguilar
LCDR Eric Zhou
LCDR Tran Trang
LCDR Alexander Varga
LCDR James Warner
CDR David Laird
References:
- Percentage of Population in the United States as of 2014, by ethnicities.
(http://www.statista.com/statistics/270272/percentage-of-us-population-by-ethnicities/)